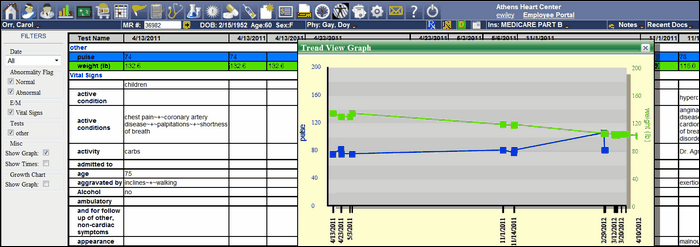
The trend view button will provide the capability to plot various data field result of lab test. This will help evaluate the progress the patient is making. The data must be available in the patient’s chart for the charting function to work. Many times the data is not available in close enough time intervals to make the chart worthwhile.
Clicking on the Trend View Tab will produce the data available to produce a graph. The left side of the screen is the filter and data selection as in Graph View Encounter Figure 14. Select the date and type of data to be displayed from the Filter column on the left side. The data will appear in the box to the right of the filter column. Select the data to be used by clicking on the rows. Up to two rows of data can be selected. Each row will have a different color.

Then Click the show graph check box and the graph will appear as Trend View Encounter Figure 15.
